



Data Science Training
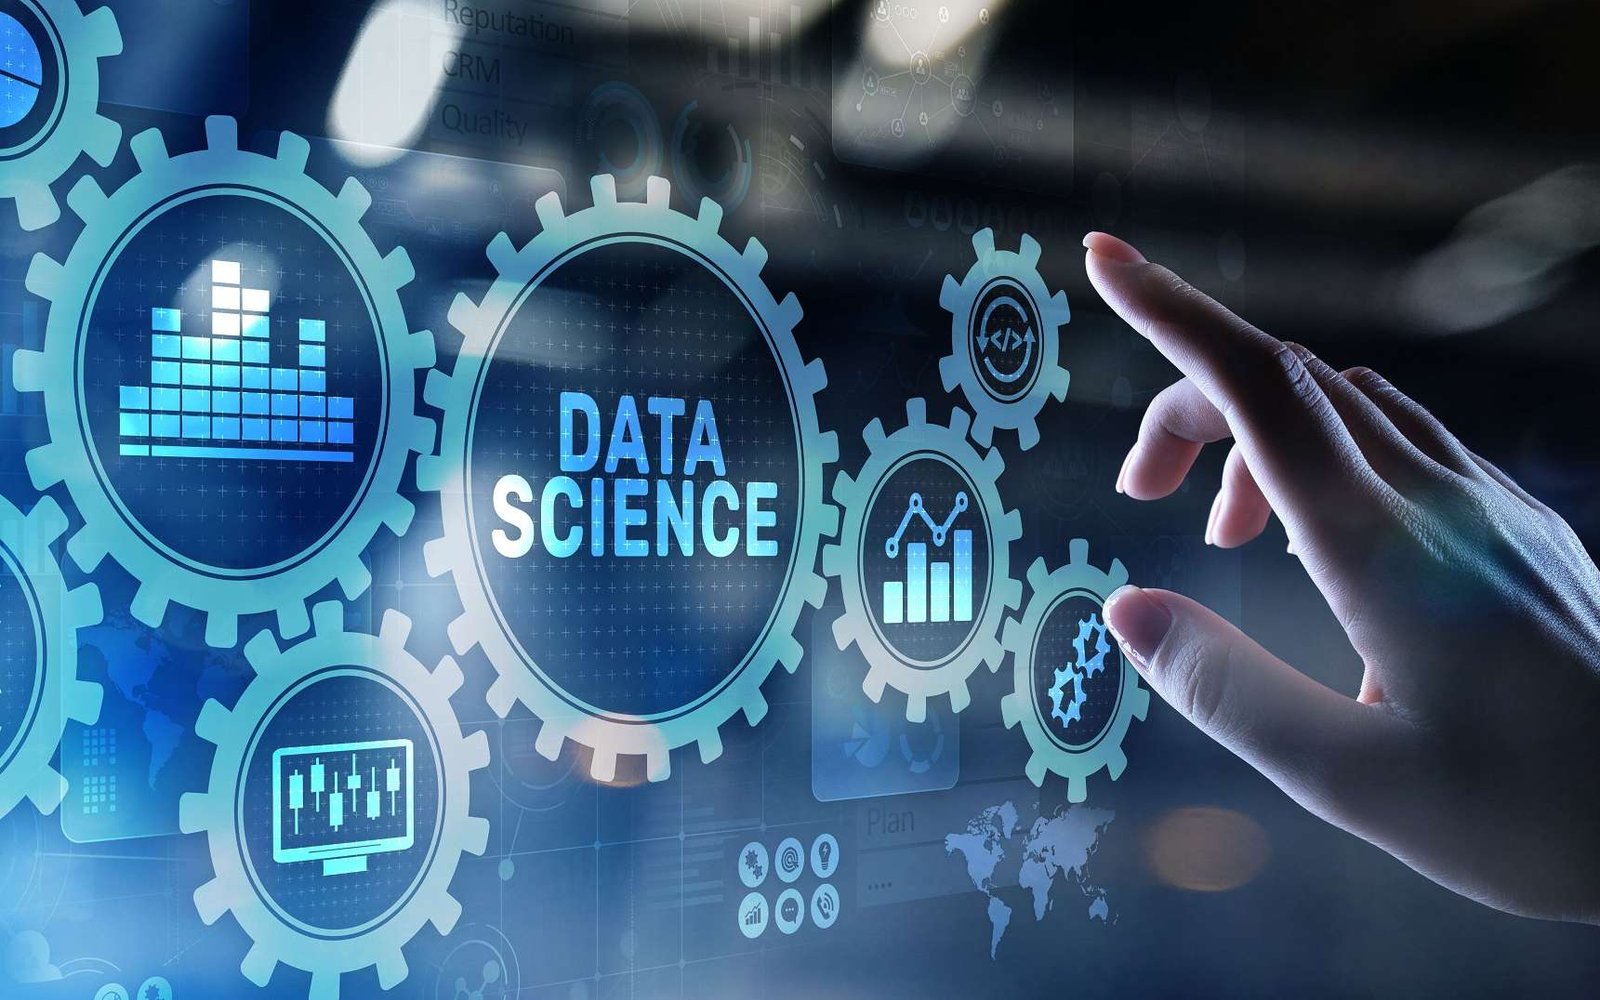
The Data Science Training Program is a hands-on course designed to prepare individuals for careers in data science and analytics. It covers key topics like data manipulation, visualization, machine learning, and big data tools such as Python, R, SQL, Tableau, and more.
Why Choose Skillairo?
Expert Mentor
Industry Exposure
LMS Access
Talk & Skills
Professional Certificate
Career Support
Programs Overview
The Data Science Training Program is a hands-on course designed to prepare individuals for careers in data science and analytics. It covers key topics like data manipulation, visualization, machine learning, and big data tools such as Python, R, SQL, Tableau, and more. Participants gain practical experience through real-world projects and receive guidance from industry experts.
With flexible learning options, career support, and an industry-recognized certification, this program is ideal for graduates, IT professionals, business analysts, and data enthusiasts. It equips learners with the skills to analyze complex datasets, build predictive models, and make data-driven decisions in a competitive job market.
Training Path
Introduction to Data Science
What is Data Science?
- Data Science Workflow
- Applications of Data Science
- Setting Up Python for Data Science
Data Manipulation and Cleaning
- Introduction to Pandas
- Data Cleaning
- Data Transformation and Feature Engineering
- Grouping, Aggregation, and Merging Data
Statistical Foundations for Data Science
- Descriptive Statistics
- Probability Basics and Distributions
- Hypothesis Testing
- Correlation and Covariance
Introduction to Machine Learning for Data Science
- Basics of Supervised and Unsupervised Learning
- Linear Regression and Logistic Regression
- Clustering Techniques (K-Means)
- Model Evaluation Metrics
Python Basics for Data Science
- Python Syntax, Variables, and Data Structures
- Functions and Control Flow
- Key Libraries for Data Science
- Working with Jupyter Notebooks
Data Visualization
- Introduction to Matplotlib and Seaborn
- Creating Line, Bar, and Scatter Plots
- Advanced Visualizations
- Interactive Visualizations with Plotly
Exploratory Data Analysis (EDA)
- Understanding the Dataset
- Detecting Patterns and Trends in Data
- Identifying Outliers and Anomalies
- Data Storytelling with Visualizations
Working with Big Data and Advanced Tools
- Introduction to Big Data and Data Lakes
- Working with Databases
- Using Python with Big Data Frameworks
- Cloud Platforms for Data Science
Skills Covered
- Generative AI
- Prompt Engineering
- ChatGPT
- JavaScript
- Data Science
- Descriptive Statistics
- Inferential Statistics
- Explainable AI
- Conversational AI
- Large Language Model
- Data Visualization
- Ensemble Learning
Industry Projects
E-commerce Website
Build an online shopping platform with product listings, user authentication, payment gateways, and order management. Focus on a smooth user experience and backend inventory management.
Blog Platform
Create a platform for users to write and publish blog posts, with features like user profiles, commenting, content management, and social sharing. Implement a simple, intuitive interface for authors and readers.
Event Management System
Develop a system for organizing, promoting, and managing events. Include features such as event registration, ticketing, calendar integration, attendee management, and event notifications.
Social Media Platform
Build a platform that allows users to create profiles, post content, follow others, like and comment on posts, and engage in direct messaging. Focus on real-time interactions and scalability.
Restaurant Reservation System
Develop a system that allows customers to book tables, view menus, make reservations, and get notifications. Implement an admin panel for managing bookings and customer details.

This project involves analyzing global or regional COVID-19 data to visualize trends, forecast future cases, and provide real-time insights through interactive dashboards. The main components include:
1. Data Collection & Preprocessing: Gather data from reliable sources (e.g., WHO, Johns Hopkins) and clean it for analysis, including handling missing data and feature engineering.
2. Exploratory Data Analysis (EDA): Visualize trends (cases, deaths, recoveries) using graphs and charts to identify patterns and anomalies.
3. Time Series Forecasting: Use models like ARIMA, Prophet, and LSTM to predict future COVID-19 cases and deaths.
4. Real-Time Dashboard Deployment: Build an interactive dashboard using tools like Plotly Dash or Streamlit to provide real-time updates and visualizations of trends.
5. Predictive Analytics & Insights: Model the impact of various factors (e.g., vaccination, lockdowns) and provide actionable insights for decision-making.
Technologies: Python, R, Scikit-learn, TensorFlow, Plotly, Dash, APIs.
Outcome: A predictive model and dashboard that offers insights for governments, healthcare organizations, and the public, supporting better decision-making during the pandemic.
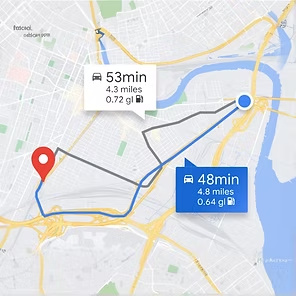
This project involves building a real-time traffic prediction system to optimize traffic flow and reduce congestion in smart cities. It uses data from traffic sensors, cameras, and historical traffic patterns to predict traffic conditions and suggest optimal routes. The key components include:
1. Data Collection & Preprocessing: Gather data from sources such as traffic sensors, GPS, and historical traffic records. Clean and preprocess the data, handling missing values and outliers.
2. Feature Engineering: Extract features like traffic density, time of day, weather conditions, and special events that affect traffic patterns.
3. Traffic Prediction Models: Use machine learning algorithms such as Random Forest, Gradient Boosting, and Deep Learning (e.g., LSTM, CNN) to predict traffic congestion in real-time.
4. Real-Time Data Integration: Integrate live data from sensors and cameras to provide real-time updates on traffic conditions and predict congestion patterns.
5. Visualization & Dashboard: Develop an interactive dashboard to display real-time traffic conditions, predicted congestion areas, and optimal route suggestions. Tools like Plotly Dash or Tableau can be used for visualization. Optimization & Route.
6. Suggestions: Use predictive models to suggest alternate routes for drivers, aiming to reduce congestion and travel time.
Technologies: Python, TensorFlow, Scikit-learn, Deep Learning (LSTM, CNN), Plotly, Dash, Real-time data integration (IoT, APIs).
Outcome: A traffic prediction system that helps reduce congestion, optimize traffic flow, and improve urban mobility in smart cities, benefiting both commuters and city planners.

This project focuses on building a machine learning model to detect fraudulent credit card transactions in real-time, helping financial institutions minimize fraud risk. It involves analyzing transaction data to identify patterns of fraud and implementing predictive models to flag suspicious activities. The key components include:
1. Data Collection & Preprocessing: Gather transaction data, including transaction amount, time, location, and customer details. Clean the data by handling missing values, encoding categorical variables, and normalizing numerical features.
2. Feature Engineering: Extract relevant features such as transaction frequency, spending behavior, and location-based patterns to help identify anomalies that may indicate fraud.
3. Modeling & Training: Apply machine learning algorithms such as Logistic Regression, Random Forest, XGBoost, and Deep Learning (e.g., Autoencoders) to classify transactions as fraudulent or legitimate.
4. Imbalanced Data Handling: Use techniques like oversampling (SMOTE), undersampling, or anomaly detection methods to address the class imbalance problem (fraudulent transactions being much less frequent than legitimate ones).
5. Model Evaluation & Optimization: Evaluate the model’s performance using metrics such as Precision, Recall, F1-Score, and ROC-AUC to ensure it effectively detects fraud while minimizing false positives.
6. Real-Time Fraud Detection System: Deploy the trained model into a real-time fraud detection system, capable of flagging suspicious transactions as they occur and triggering alerts.
Technologies: Python, Scikit-learn, XGBoost, Keras, TensorFlow, SMOTE, Real-time data integration (APIs).
Outcome: A fraud detection system that helps credit card companies identify and prevent fraudulent transactions, protecting customers and minimizing financial losses.

This project aims to develop a machine learning model to optimize ticket pricing for airlines based on demand, competition, seasonality, and other market factors. By predicting the optimal price for flights, airlines can maximize revenue while ensuring competitiveness. The key components include:
1. Data Collection & Preprocessing: Gather data on historical flight prices, customer booking behavior, competitor prices, flight routes, weather conditions, and holidays. Clean and preprocess the data by handling missing values, encoding categorical features, and scaling numerical variables.
2. Feature Engineering: Extract relevant features such as time to departure, seasonality, day of the week, and competitor pricing to understand their impact on demand and pricing strategies.
3. Demand Forecasting: Use time series forecasting models like ARIMA, Prophet, or machine learning models (Random Forest, XGBoost) to predict flight demand based on historical trends, economic conditions, and special events.
4. Price Optimization Models: Develop a pricing optimization model using machine learning algorithms like Linear Regression, Random Forest, and Reinforcement Learning to suggest the best price point for each flight, maximizing revenue while considering demand elasticity.
5. Dynamic Pricing Strategy: Implement a dynamic pricing system that adjusts flight prices in real-time based on factors such as remaining seats, booking trends, competitor prices, and time to departure.
6. Model Evaluation & Optimization: Evaluate the model’s performance using metrics such as Mean Absolute Error (MAE) and Root Mean Squared Error (RMSE) for demand prediction, and assess the revenue impact of price optimization.
7. Dashboard & Reporting: Develop a dashboard to visualize pricing trends, revenue forecasts, and the impact of price changes. Use tools like Tableau or Plotly Dash for real-time insights.
Technologies: Python, Scikit-learn, XGBoost, ARIMA, Prophet, Reinforcement Learning, Tableau, Plotly Dash.
Outcome: A price optimization system that helps airlines set competitive prices, maximize revenue, and enhance customer satisfaction by adjusting prices based on real-time demand and market conditions.

This project focuses on building a recommendation system to provide personalized product or content suggestions to users based on their preferences, behavior, and interactions. The system can be applied to e-commerce platforms, streaming services, or any business aiming to enhance user experience and drive engagement. The key components include:
1. Data Collection & Preprocessing: Gather data on user interactions, such as clicks, views, ratings, and purchase history. Clean and preprocess the data by handling missing values, encoding categorical variables, and normalizing numerical features.
2. Types of Recommendation Systems: Collaborative Filtering: Use user-item interactions to recommend items based on similar user preferences. Techniques include user-based and item-based collaborative filtering using similarity metrics like cosine similarity or Pearson correlation. Content-Based Filtering: Recommend items similar to those a user has interacted with, based on item features such as categories, tags, and descriptions. Hybrid Methods: Combine collaborative filtering and content-based filtering to provide more accurate and diverse recommendations.
3. Modeling & Training: Apply machine learning models like Matrix Factorization (e.g., Singular Value Decomposition), K-Nearest Neighbors (KNN), or Deep Learning techniques (e.g., Neural Collaborative Filtering) to train the recommendation system.
4. Evaluation & Optimization: Evaluate the model’s performance using metrics such as Precision, Recall, F1-Score, Mean Squared Error (MSE), and Root Mean Squared Error (RMSE). Fine-tune the model using cross-validation and hyperparameter optimization.
5. Real-Time Recommendations: Deploy the recommendation system to provide real-time suggestions based on user behavior and interactions. Update recommendations dynamically as new data is collected.
6. Personalization & Filtering: Implement personalization features that tailor recommendations based on user demographics, preferences, and historical behavior, and use filtering techniques to ensure the suggestions are relevant.
7. Visualization & Dashboard: Develop a dashboard to visualize recommendation patterns, user interactions, and model performance. Tools like Plotly Dash or Tableau can be used for real-time insights.
Technologies: Python, Scikit-learn, TensorFlow, Keras, Surprise (Collaborative Filtering), LightFM (Hybrid Methods), Plotly Dash, Tableau.
Outcome: A personalized recommendation system that enhances user experience by providing relevant suggestions, improving user engagement, increasing sales or content consumption, and fostering customer loyalty.
Certifications
Get certified in Data Science through our program and receive both a Training Completion Certificate and an Internship Completion Certificate. The prestigious Top Performer Certificate is awarded to outstanding students who performed exceptionally well during both the training and internship phases.



Pricing Plan
At SkillAiro, we’re committed to making high-quality education accessible to all. We’ve structured our programs with transparent and competitive pricing to suit a variety of learning needs.
Data Science Industry Trends
These trends underscore India’s expanding role in the global data science landscape, supported by a robust IT industry and a growing pool of skilled professionals.
33.7% Annual Growth Rate

The data science and analytics sector in India is experiencing significant growth, with the data science platform market projected to expand from USD 155.9 million in 2020 to USD 1,193.1 million by 2027, reflecting a compound annual growth rate (CAGR) of 33.7%.
According to a report by IMARC Group, the India data science platform market is expected to grow at a compound annual growth rate (CAGR) of 19.90% during the forecast period from 2024 to 2032.
Other Key Industry Trends
- In terms of revenue, India accounted for 3.2% of the global data science platform market in 2020.
- Country-wise, the U.S. is expected to lead the global market in terms of revenue in 2027.
- In the Asia-Pacific region, the China data science platform market is projected to lead the regional market in terms of revenue in 2027.
- India is the fastest-growing regional market in Asia-Pacific and is projected to reach USD 1,193.1 million by 2027.
In India, data scientists earn an average annual salary of approximately ₹1,206,500, with total compensation around ₹1,396,500 per year. Entry-level positions start at about ₹3.8 lakhs per year, while experienced professionals can earn up to ₹31.6 lakhs annually.Salaries vary by location, with Gurgaon offering an average of ₹13,91,002 per year, Bengaluru at ₹12,33,521, and Hyderabad at ₹12,09,141.
The data science industry in India is experiencing significant growth, with projections indicating a 15-20% increase in job opportunities across various sectors by 2025.
INR 3.8-31.6 L Annual Salary

Student Testimonial

At SkillAiro, we’re committed to making high-quality education accessible to all. We’ve structured our programs with transparent and competitive pricing to suit a variety of learning needs.
Anamika ,
Web Developer
At SkillAiro, we’re committed to making high-quality education accessible to all. We’ve structured our programs with transparent and competitive pricing to suit a variety of learning needs.
Anamika ,
Web Developer
At SkillAiro, we’re committed to making high-quality education accessible to all. We’ve structured our programs with transparent and competitive pricing to suit a variety of learning needs.
Anamika ,
Web Developer
At SkillAiro, we’re committed to making high-quality education accessible to all. We’ve structured our programs with transparent and competitive pricing to suit a variety of learning needs.
Anamika ,
Web Developer
At SkillAiro, we’re committed to making high-quality education accessible to all. We’ve structured our programs with transparent and competitive pricing to suit a variety of learning needs.
Anamika ,
Web Developer
Our Alumni Work At
Our alumni are already pushing boundaries in their fields. Former students are excelling in high-profile industries and influencing the landscape of tomorrow.
RECOGNITION FROM


Frequently Asked Questions
What is a Data Science training?
A Data Science training program equips individuals with the skills and knowledge required to analyze, interpret, and derive insights from complex data. It typically covers topics like data cleaning, statistical analysis, machine learning, data visualization, and programming languages such as Python and R. The program often includes hands-on projects and real-world case studies to build practical experience in working with data, preparing individuals for careers in data science, analytics, and related fields.
What does a Data Scientist do?
A data scientist processes and analyzes large datasets using techniques like data wrangling, statistical modeling, and machine learning algorithms. They extract actionable insights from structured and unstructured data, leveraging tools such as Python, R, SQL, and big data technologies. Their work informs data-driven decision-making and problem-solving within organizations. Our data science training program provides the technical expertise required to master these skills.
Who are the instructors for this Data Science training program, and how are they selected?
Our data science trainers are seasoned industry professionals with extensive experience in machine learning, Python for data science, and applied data science. We also ensure that only trainers with excellent alumni ratings continue to be part of our faculty.
What will be the career path after completing the Data Science program online?
After completing online data science training program, career paths include roles such as Data Analyst, Data Scientist, Machine Learning Engineer, Business Intelligence Analyst, Data Engineer, and AI Specialist. With experience, you can advance to leadership positions like Data Science Manager or Chief Data Officer.
Which industries use Data Science the most?
Data science is being applied across various industries, including healthcare, banking, finance, retail, automotive, marketing, manufacturing, and government. Sectors like technology, advertising, energy, and utilities also hire numerous data scientists. This data science certification course is valuable for anyone aiming to pursue a career in these fields.
Can I pay the fee in installments?
Yes, you can secure your spot by paying a pre-registration fee of 1000 INR. The remaining balance can be paid before the program begins.
Will I get an internship?
Yes, at Skillairo, we offer guaranteed internship opportunities for all students across all our courses, providing hands-on experience to enhance their learning and career prospects.
How long is the training?
Our Self-paced and Mentor-led training program both last for a period of 2-3 months. Our Advanced training program last for a period of 4 months.
Talk to Expert
At Skillairo, we help students and aspiring professionals gain industry-ready skills through expert-led training, hands-on projects, internships, and career guidance.